Chi Square
X^2 is the statistics no need to take square root of it.
P-Value is what we are after.
X^2 (chi-square) is a step towards P-Value.
Like 10 year old explanation
Alright! Imagine you have a bag of candies with 3 red candies and 2 blue candies. You expect to eat candies equally because you think the colors don't matter. But when you actually pick candies and count how many of each color you eat, you find you ate 4 red candies and 1 blue candy.
Now, you're curious: "Is this just a coincidence, or do I actually pick red candies more often?"
Chi-Square is Like a Detective
Chi-square is a math detective that helps you figure this out! It compares:
- What you actually observed (4 red, 1 blue)
- What you expected (3 red, 2 blue)
It looks at the difference between these two and asks: "Are these differences big enough to be suspicious, or is it just random?"
How Does It Work?
-
Start with a Guess:
- You guess that candies are eaten equally (this is called your "null hypothesis").
-
Detective Work:
- The chi-square detective calculates how far the observed numbers (4 red, 1 blue) are from your expected numbers (3 red, 2 blue).
- Bigger differences mean it might not be random!
-
Decision Time:
- If the difference is too big, the detective says, "Something is going on! Maybe you like red candies more!"
Why Is It Useful?
Chi-square helps in many situations, like:
- Checking if people like one brand over another.
- Seeing if animals prefer certain foods.
- Figuring out if ads work better for one group of people.
In short, chi-square helps us see if differences are real or just random chance. 🍭
Original Definition Note
Concept: Chi-Square Test in Marketing Science
Purpose:
The Chi-Square Test is a statistical method used to determine whether there is a significant association between categorical variables. In marketing science, it is commonly applied to validate hypotheses related to customer behavior, campaign performance, and demographic segmentation.
Key Idea:
The chi-square test compares the observed data with the expected data under the assumption of no significant difference (null hypothesis). It is particularly effective in analyzing survey results, A/B tests, and other categorical datasets.
Use Case:
- A/B Testing: Comparing performance between two ad campaigns to see if one performs significantly better.
- Demographic Segmentation: Checking if a specific age group is more likely to respond to a product offer.
- Attribution Analysis: Evaluating if conversions are evenly distributed across marketing channels.
Steps for Chi-Square Test:
-
Set Up Hypotheses:
- Null Hypothesis (H₀): There is no significant difference or relationship.
- Alternative Hypothesis (H₁): There is a significant difference or relationship.
-
Collect and Categorize Data:
- Divide data into observed and expected frequencies in a contingency table.
-
Calculate Chi-Square Statistic:
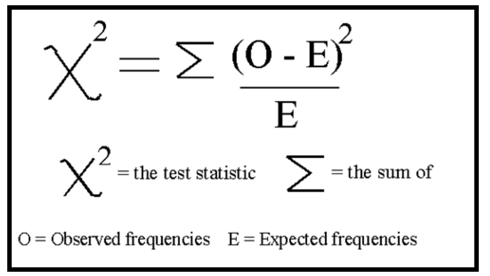
- Formula:
[ \chi^2 = \sum \frac{(O_i - E_i)^2}{E_i} ]
where (O_i) = observed frequency, (E_i) = expected frequency.
- Formula:
-
Determine the P-Value:
- Compare the test statistic against the chi-square distribution with the appropriate degrees of freedom.
-
Draw Conclusions:
- If the p-value < significance level (e.g., 0.05), reject the null hypothesis.
Visualization:
Example:
A marketing team tests two email subject lines:
- Observed: 200 opens for Subject Line A, 250 opens for Subject Line B.
- Expected: Equal performance (225 opens each).
Using the chi-square formula, they find that the difference is significant with a p-value of 0.03, indicating Subject Line B is more effective.
Application in Certification:
- Key Question: How to interpret chi-square results for decision-making.
- Answer Focus: Explain null/alternative hypotheses, interpret p-values, and relate results to marketing insights.
Summary:
The chi-square test is an essential tool for analyzing categorical data in marketing, offering insights into customer behavior and campaign effectiveness. It helps marketers make data-driven decisions by validating statistical significance in observed patterns.
Terms
P-Value is Luck Meter
The P-value in a chi-square test is like a score that tells you how likely it is that your results happened just by random chance.
Think of It Like This:
Imagine you're flipping a coin, and you expect it to land on heads and tails equally. But when you flip it 10 times, you get 8 heads and 2 tails. Now you wonder, "Is this coin unfair, or did I just get lucky (or unlucky)?"
The P-value tells you:
- If the coin is fair (random chance): Getting 8 heads in 10 flips is very rare (P-value is small).
- If the coin is unfair (not random): The difference might not just be luck.
What Does the P-Value Mean?
- Small P-value (e.g., less than 0.05):
- This means it’s very unlikely the difference happened by chance.
- In the candy example, this would suggest you really do prefer red candies!
- Large P-value (e.g., more than 0.05):
- This means the difference is likely due to random chance.
- In the candy example, it might just be a coincidence.
In the Chi-Square Test:
- Calculate the Chi-Square Statistic (a number that shows how big the difference is between what you saw and what you expected).
- Find the P-value:
- This tells you how surprising that chi-square statistic is.
- Decide:
- If P-value < 0.05: You reject the "random chance" idea (null hypothesis).
- If P-value > 0.05: You say, "The differences are probably random."
In simple terms, the P-value is your "luck meter":
A small P-value means "Whoa, this result isn’t just luck!"
Relationships
- Comparing with P-Value with Significance Level
Whats needed?
Chi-Square & Degrees of Freedom.
Key Parts
Always 2 Hypothesis
Yes, in a chi-square test, you always have two hypotheses:
1. Null Hypothesis (H₀):
- This is the default assumption: "There is no relationship or difference."
- In practical terms, it means what you observe is just random chance, and the data fits your expectations.
- Example:
- For candies, H₀ could be: "The number of red and blue candies picked is the same as expected."
2. Alternative Hypothesis (H₁):
- This is what you test against the null hypothesis: "There is a relationship or difference."
- If the observed data is significantly different from the expected, you reject the null hypothesis in favor of the alternative.
- Example:
- For candies, H₁ could be: "The number of red and blue candies picked is different from what I expected."
Why Do You Need Both?
Having two hypotheses ensures you're testing something specific:
- You start with the assumption (H₀) that there’s no effect or relationship.
- The data tells you whether to reject H₀ (and support H₁) or to stick with H₀ (because you didn’t find enough evidence).
Important Note:
Even if you reject the null hypothesis, it doesn’t prove the alternative hypothesis is true; it just shows the observed data is unlikely under H₀. In statistics, you're always testing for evidence, not proving absolute truth.
Diving into the math
Diving into the math


How to know if its statistically significant
How to Know if It's Statistically Significant
-
Calculate the Test Statistic:
-
Find the P-Value:
Let a statistical tool or software calculate the p-value based on the test statistic and degrees of freedom. -
Compare the P-Value to the Significance Level (( \alpha )):
- If ( P < \alpha ) (e.g., 0.05): Statistically significant (reject the null hypothesis).
- If ( P \geq \alpha ): Not statistically significant (fail to reject the null hypothesis).
-
Conclusion:
- Statistically significant results suggest the observed differences are unlikely due to chance.
Example:
- Test Statistic: ( \chi^2 = 10.8 ).
- Degrees of Freedom: 3.
- P-value: 0.013.
- Conclusion: ( P < 0.05 ), so the result is statistically significant.
Questions:
How to Get the P-Value in a Chi-Square Test
The P-value in a Chi-Square test tells you the probability of observing your results (or something more extreme) if the null hypothesis is true. A smaller P-value suggests the observed differences are unlikely due to chance.
Steps to Calculate the P-Value
-
Calculate the Chi-Square Statistic (( \chi^2 )):
Use the formula:
χ² = Σ [(O - E)² / E]where:
- ( O ): Observed value.
- ( E ): Expected value.
-
Determine Degrees of Freedom (df):
For one variable:
df = (number of categories - 1)For contingency tables:
df = (rows - 1) × (columns - 1) -
Use Software or a Chi-Square Table to Find the P-Value:
- Input ( \chi^2 ) and df into statistical software or look up the P-value in a Chi-Square table.
- Compare the P-value to the significance level (( \alpha )).
Example 1: Red and Blue Candies
- Observed Counts (O): Red = 40, Blue = 20.
- Expected Counts (E): Red = 30, Blue = 30.
-
Calculate ( \chi^2 ):
χ² = [(40 - 30)² / 30] + [(20 - 30)² / 30] = [10² / 30] + [(-10)² / 30] = (100 / 30) + (100 / 30) = 6.67 -
Determine df:
df = (number of categories - 1) = 2 - 1 = 1 -
Use software to calculate the P-value:
- For ( \chi^2 = 6.67 ) and ( df = 1 ), ( P = 0.0098 ).
-
Compare P to ( \alpha ) (e.g., 0.05):
P = 0.0098 < 0.05Conclusion: The result is statistically significant.
Example 2: Contingency Table
Testing candy preference by age group:
| Red Candies | Blue Candies | Total | |
|---|---|---|---|
| Kids | 50 | 30 | 80 |
| Adults | 20 | 40 | 60 |
| Total | 70 | 70 | 140 |
-
Calculate expected values for each cell:
Expected = (row total × column total) / grand totalExample for Kids-Red:
Expected = (80 × 70) / 140 = 40 -
Compute ( \chi^2 ):
χ² = Σ [(O - E)² / E] = [(50 - 40)² / 40] + [(30 - 40)² / 40] + ... = 2.5 -
Determine df:
df = (rows - 1) × (columns - 1) = (2 - 1) × (2 - 1) = 1 -
Calculate P-value:
- For ( \chi^2 = 2.5 ) and ( df = 1 ), ( P = 0.113 ).
-
Compare P to ( \alpha ):
P = 0.113 > 0.05Conclusion: The result is not statistically significant.
Summary:
- Formulas:
- ( \chi^2 = Σ [(O - E)² / E] )
- ( df = (categories - 1) ) or ( (rows - 1) × (columns - 1) ).
- Use software (e.g., Python, R) or tables to find the P-value.
- Compare P-value to ( \alpha ) to decide if the result is significant.
- What inputs are needed to input to get the P-Value from software?
Questions
TODO
Children
- Always 2 Hypothesis
- Chi-Square Original Definition Note
- Chi-Square as 10 year old explanation
- Degrees of Freedom
- Diving_into_the_math
- Is It Statistically Significant
- P Value is Luck Meeter (Large is Luck, Small is Not Chance)
Backlinks